Introduction to analytics dashboard
Last updated: August 13, 2025
Videosync provides a comprehensive analytics dashboard that gives you insights into your event performance. You can access the analytics by navigating to Analytics Dashboard in your event. The dashboard shows you detailed information about your registered participants, viewer engagement, and teleconference activity.
Analytics overview
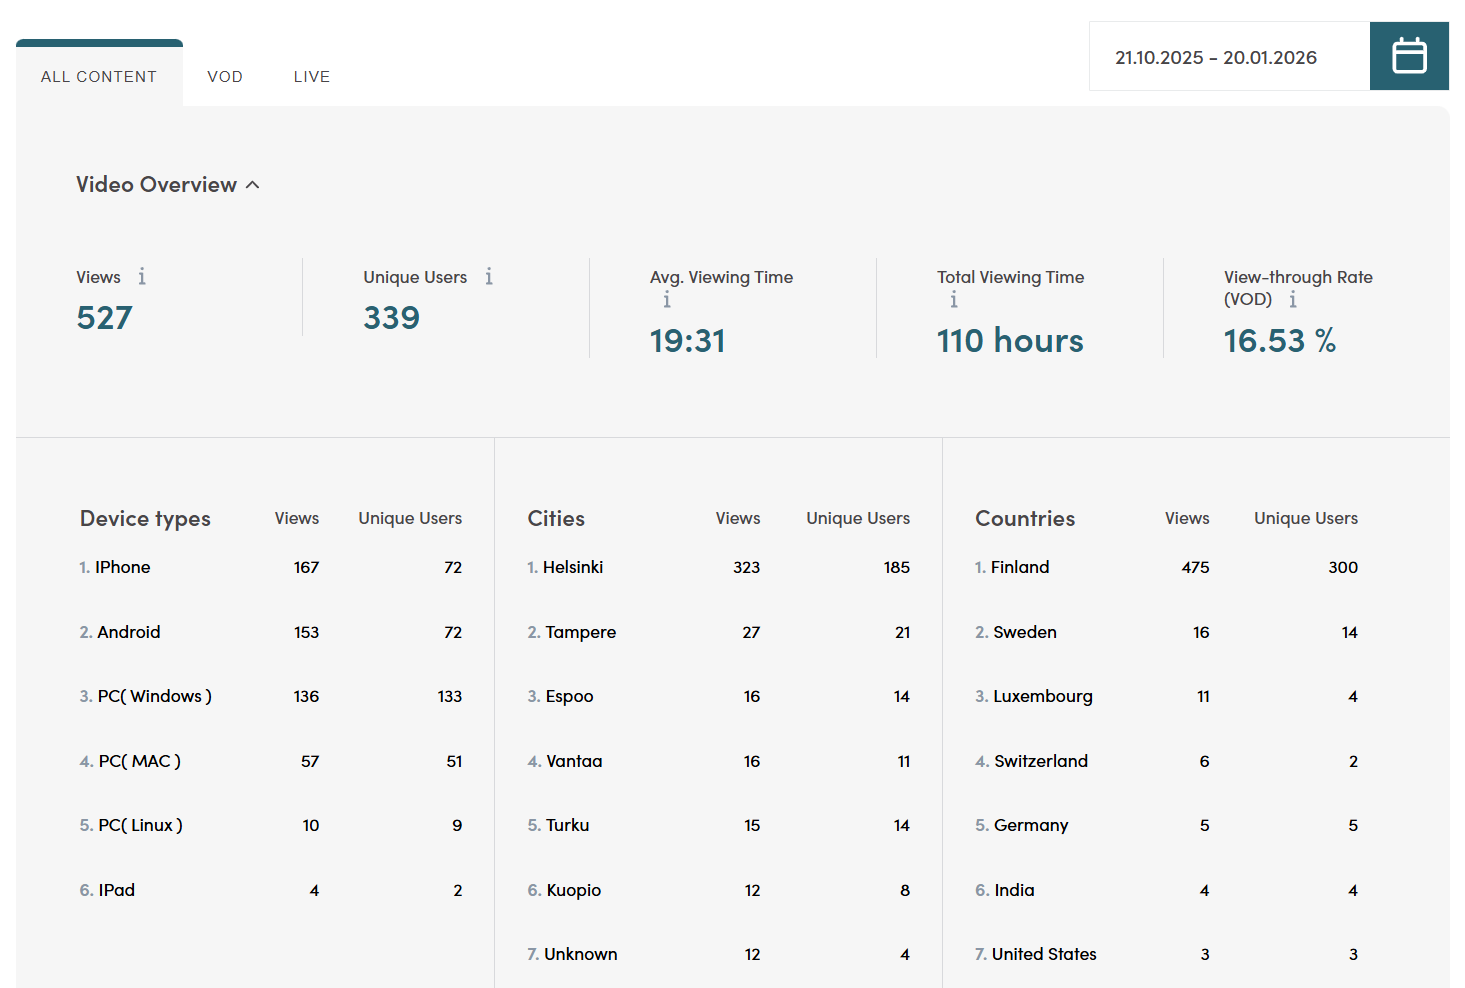
The Video Overview section displays key metrics for your event:
- Views — The total number of video views.
- Unique Users — The number of individual viewers.
- Avg. Viewing Time — The average time each viewer spent watching.
- Total Viewing Time — The combined viewing time across all viewers.
- View-through Rate (VOD) — The percentage of the video that was watched on average.
You can filter the data by content type using the tabs at the top: All Content, VOD (video on demand), or Live. A date range picker allows you to analyze specific time periods.
Below the overview metrics, you can see breakdowns by Device types, Cities, and Countries, showing views and unique users for each category.
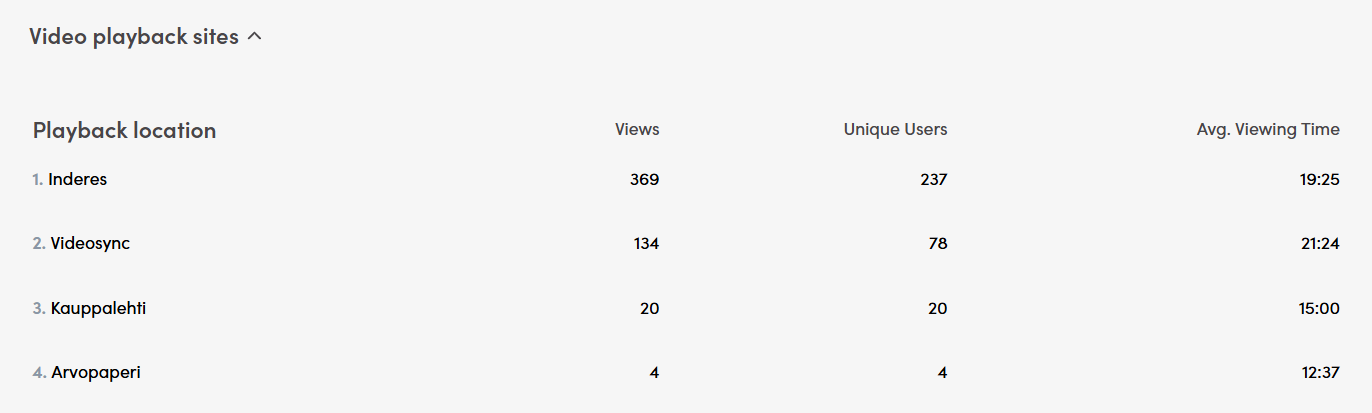
Playback sites
The Video playback sites section shows viewer statistics from different embed locations. When you embed the Videosync player on external websites, you can add an &embed-location= parameter to the embed code to identify each location. This allows you to track which sites are driving the most views.
For each playback location, you can see:
- Views — Total video views from that location.
- Unique Users — Number of individual viewers.
- Avg. Viewing Time — Average time viewers spent watching from that location.
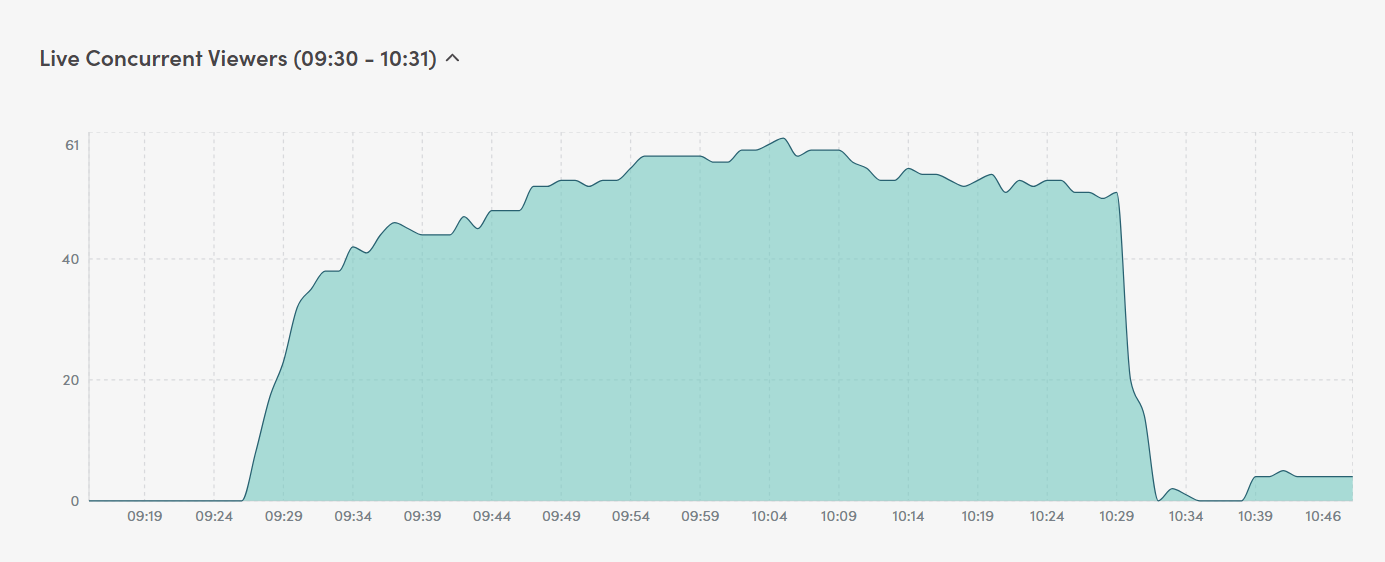
Live concurrent viewers
The Live Concurrent Viewers chart shows how many viewers were watching your live stream at any given moment. This helps you understand audience engagement patterns during the broadcast, such as when viewers joined, peak viewership, and when they dropped off.
The chart displays the time range of the live stream on the horizontal axis and the number of concurrent viewers on the vertical axis.
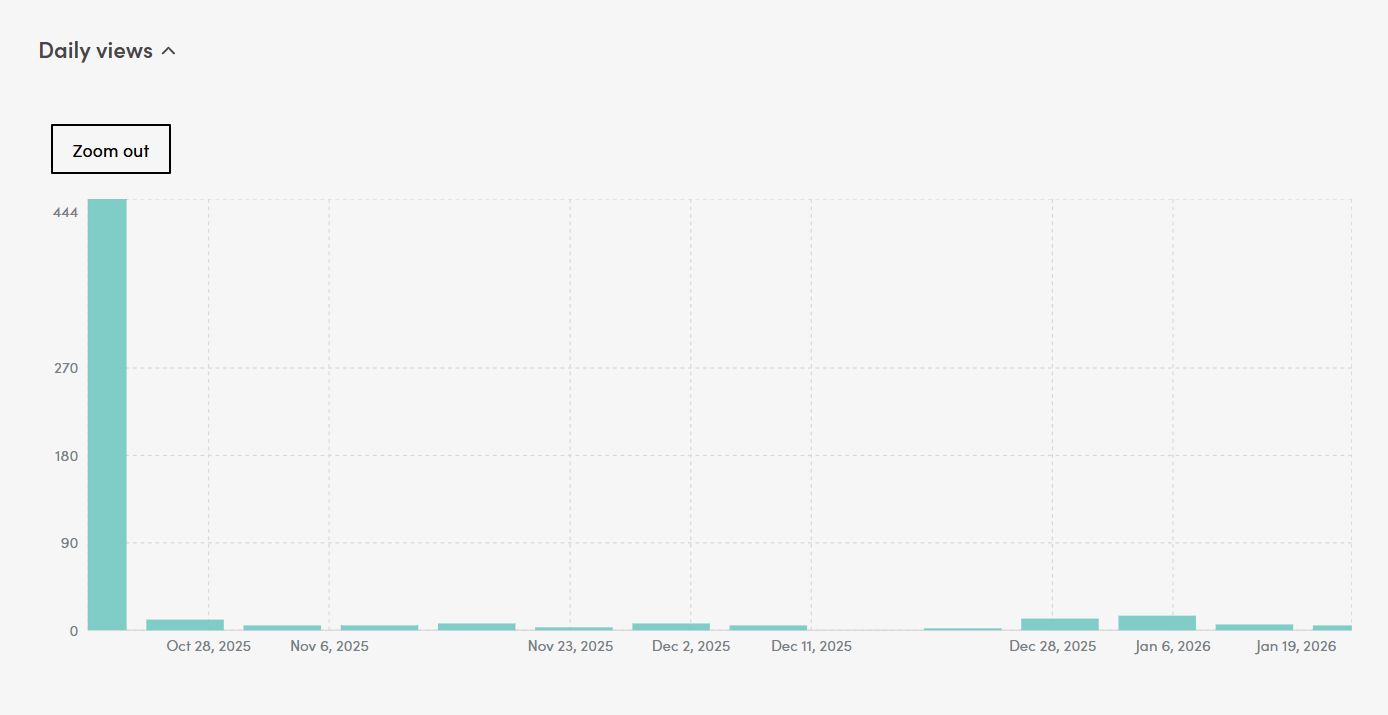
Daily views
The Daily views chart shows how many times your content was viewed each day. This is useful for tracking the long-term performance of your recording after the live event.
Typically, you’ll see a large spike on the day of the live event, followed by a “long tail” of views as people watch the published recording over time. This helps you understand the ongoing value of your content beyond the initial live broadcast.
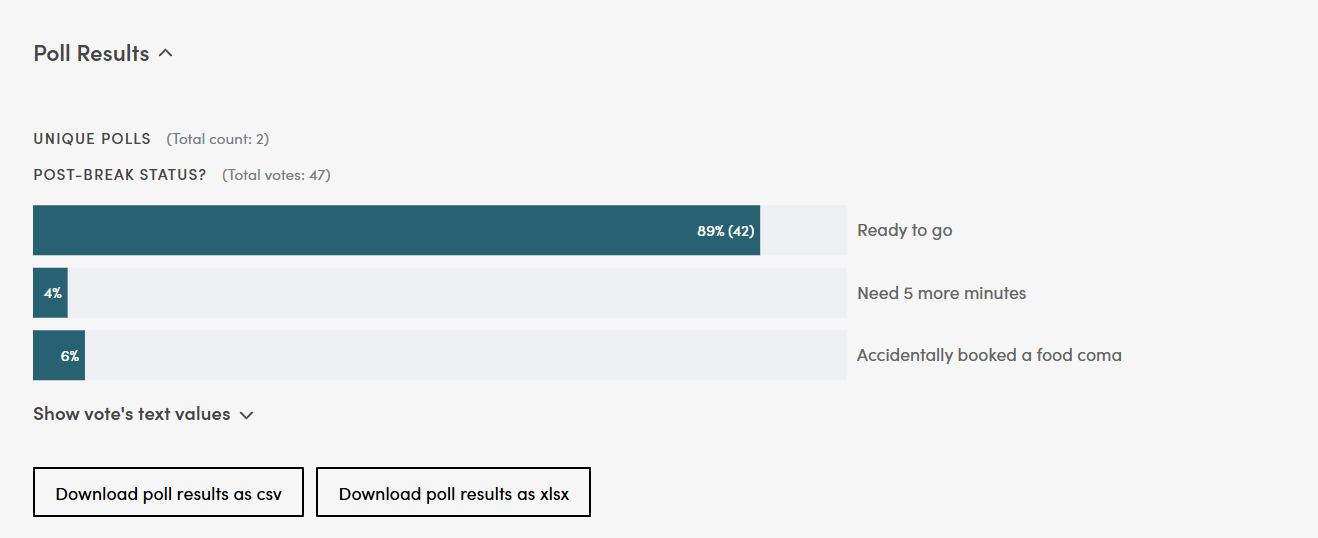
Poll and survey results
The Poll Results section displays the results from all polls conducted during your event. For each poll, you can see the total number of votes and a breakdown of responses with percentages and vote counts.
You can expand “Show vote’s text values” to see individual text responses if your poll included open-ended questions.
Poll results can be exported for further analysis using the Download poll results as csv or Download poll results as xlsx buttons.
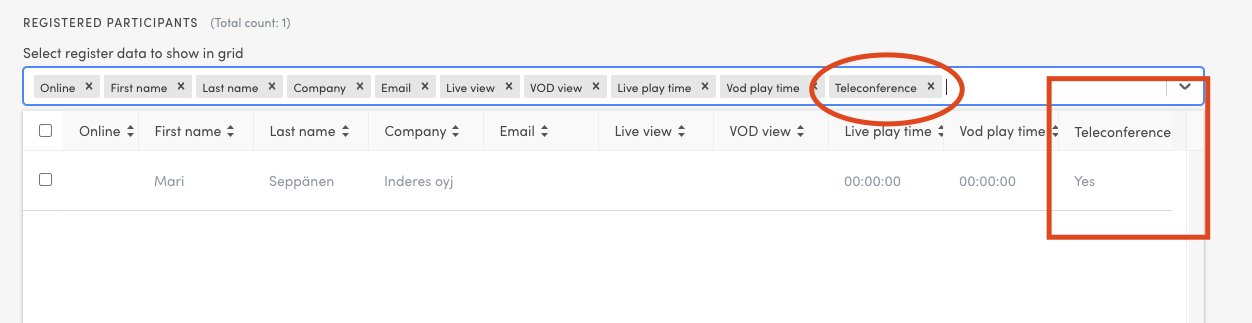
Registered participants
It takes a while after end of the stream until the analytics data is ready.
This section shows the registered participants. You can filter this list or add columns that are not shown by default which is often quite useful. For example, you can find the registered Telco participants in Analytics Dashboard under “Registered participants” if you enable “Teleconference” row as in the picture.
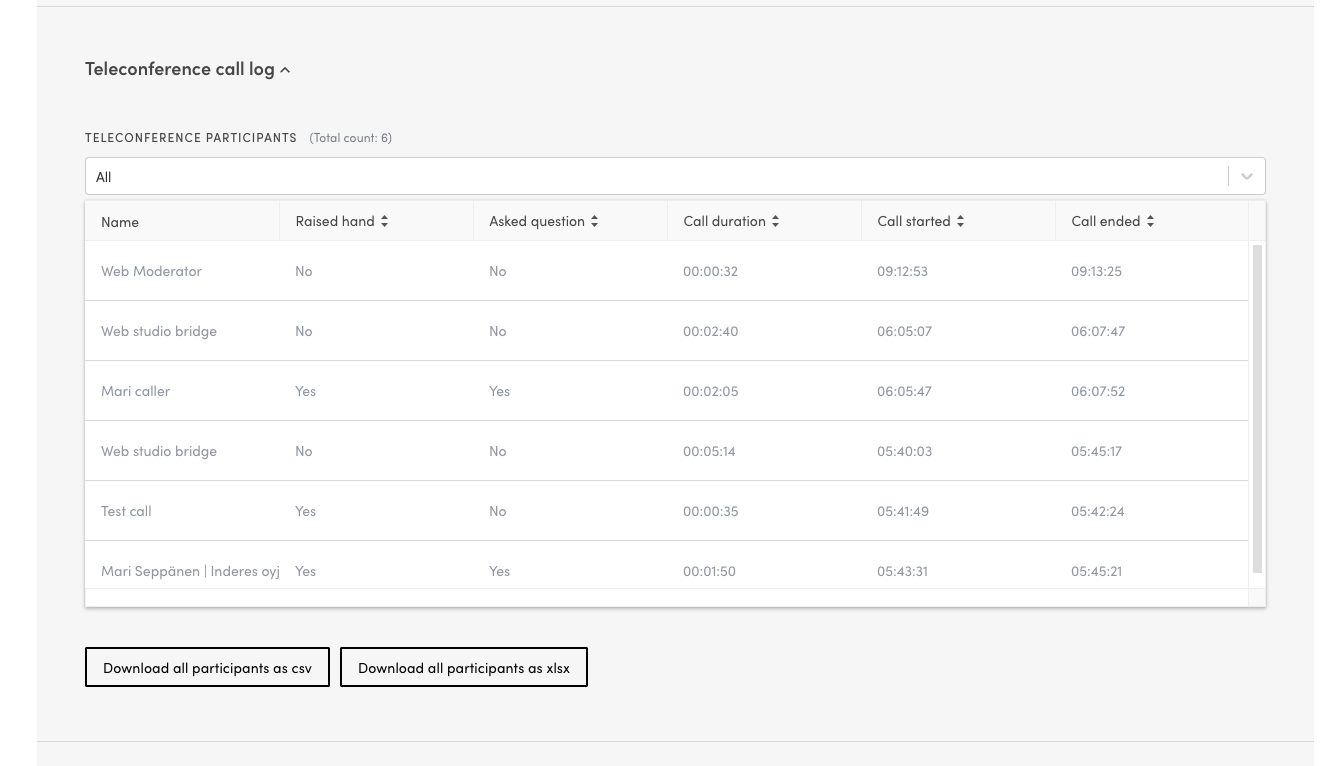
And people who have been in the teleconference call, you can see under “Teleconference call log” as shown in this screenshot:
Emoji reaction stats
The Emoji & Contact Reactions section shows how your audience engaged with your live webinar through emoji reactions. You can see the total count of reactions and a breakdown by reaction type (claps, hearts, thumbs up, laughs, rockets, etc.).
The timeline chart displays when reactions were given throughout the broadcast, helping you identify which moments resonated most with your audience.

Can't find what you're looking for?
Our AI assistant is here to help you find the information you need.